Measuring the ROI of Product Data Quality – Dynamic Investment Appraisal (part 3)
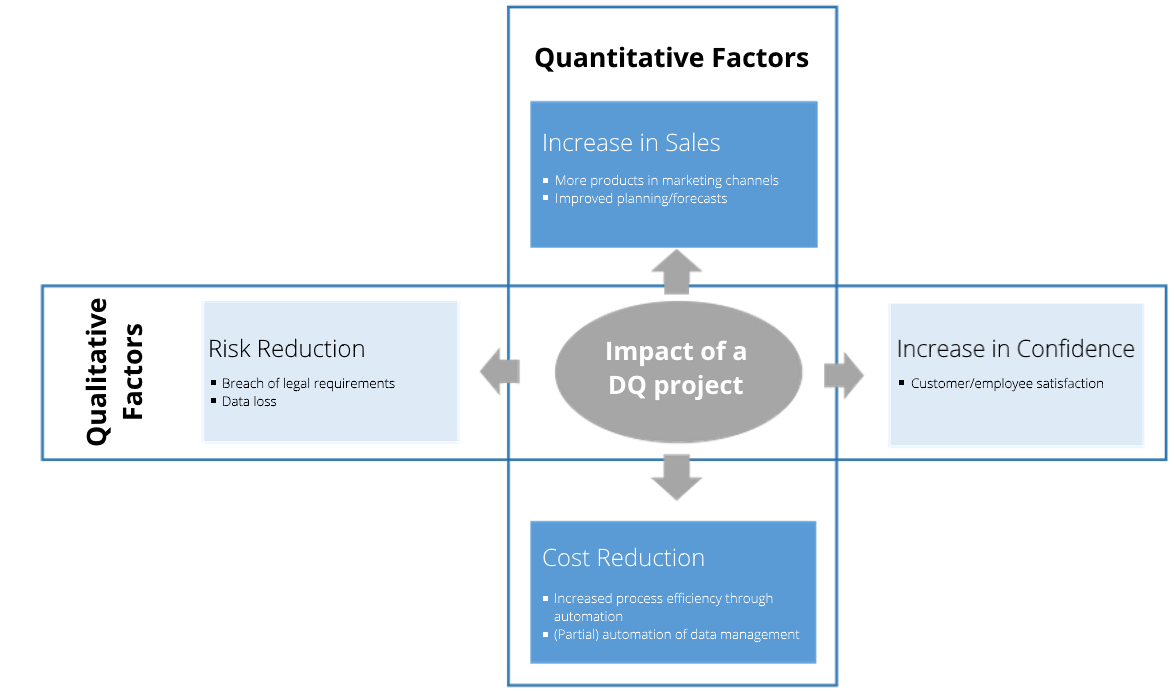
From an economic perspective, DQ projects are simply long-term investments to reduce costs and/or increase sales. In addition to these quantitative, and thus tangible, factors, you will also have to take into account qualitative aspects, that are hard to measure, such as risk reduction or increase in satisfaction associated with data quality initiatives. Think of, for example, a data manager: each data record will require less effort; he will have to deal with less returns and less errors. This fact alone is likely to lead to higher employee satisfaction and increased productivity.
The net present value method (‘NPV’), a dynamic investment appraisal method, is one of the most widely-used techniques for analysing a potential investment opportunity and can be used to assess the business impact of measurable, quantitative factors. It is a capital budgeting technique that takes into account the time value of money. €100 today, for example, are worth more than €100 received a year from now, because you could invest them and get (more or less) interest on the investment.
In terms of investment decisions for DQ projects, it means that the future benefits from the investment (see quantitative factors) should not only exceed the costs of the project. They should also be higher than the minimum required rate of return (the discount rate) that could have been achieved on the market if an equally risky investment had been made. A positive net present value indicates that the project was a good investment. The net present value (NPV) is calculated as follows:

To simplify matters, in this case the net cash inflow refers to the difference between costs (licence and project costs) and benefits of the DQ software. The benefits are based on the “business value” of the DQ software and are usually assessed with a customer’s subject matter expert. In order to do that, existing process and data management costs will have to be calculated and potential savings through (semi) automatic workflows evaluated. Sales increase due to, for example, reduced time to market of products.should also be taken into account.
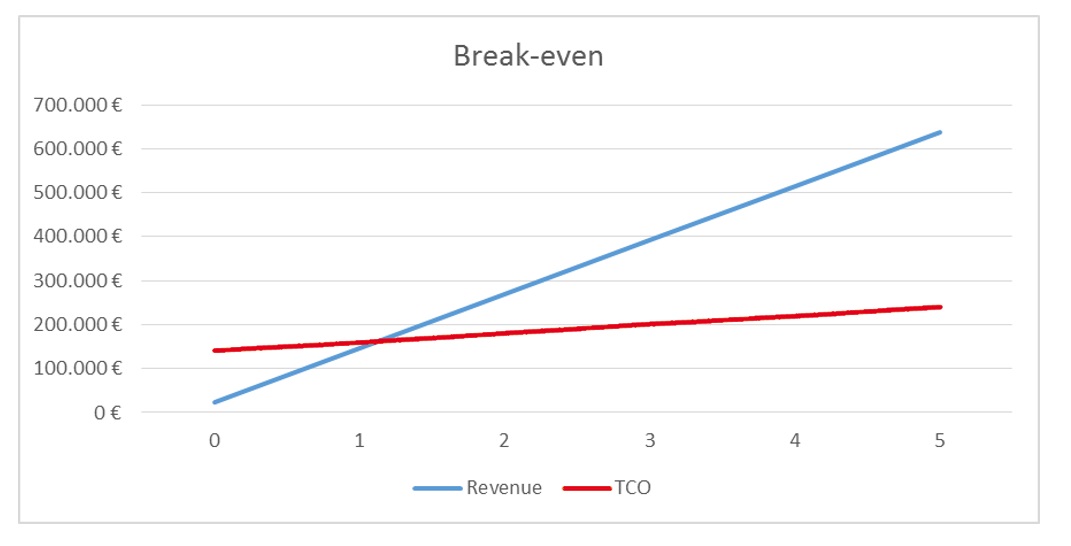
With the projected cost-benefit analysis you will be able to determine when you will reach the break-even point, i.e. the point when you will begin to make a profit from your investment in data quality. The following graph shows, for example, that the break-even point will be reached after a little over a year.
If you are interested in calculating the overall Return on Investment in a (current or future) DQ project, please contact
Miriam Ambrosinow
+49 711/75886-634
sales@parsionate.com
Read the other parts of this article series as well:
Part 1: Measuring the ROI of Product Data Quality – Basic Principles
Part 2: Measuring the ROI of Product Data Quality – Project Approach