Measuring the ROI of Product Data Quality – Project approach (part 2)
A few, preliminary steps have to be taken in order to calculate the Return on Investment of effective data quality management initiatives. You usually start with a subjective and objective assessment of data quality. Subjective assessment of data quality is based on interviews with experts from different fields and departments. They have to deal with “their” data every day and they know exactly where the problems are. But there is a drawback: quite often, in such interviews, people will only point out symptoms, but the actual cause of data quality problems is often to be found elsewhere. This is mainly due to the fact that head of departments are generally focused on their domain. A problem in the process of entering data in the ERP system may, for example, affect the quality of the online shop, but it would be highly inefficient and expensive to try to solve this problem at the end of the process, i.e. on the online shop (see 1-10-100 rule in part 1).
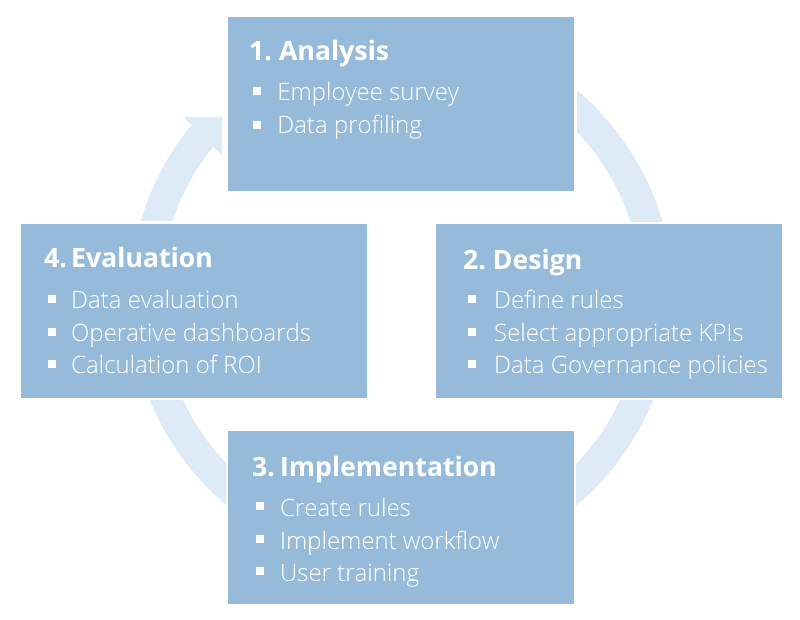
Once the weakest points have been identified, data quality will have to be assessed objectively using different data profiling techniques. These range from simple column profiling, where all the values are analysed within each column or attribute, to complex, enterprise-wide “Data Domain Discovery” processes, where a semantic analysis of data is performed and where sensitive “Data Domains” (e.g. personal data) are identified and assessed as to whether they unintentionally occur in system domains where they may pose a security risk.
After this analysis, data and process quality improvement rules will have to be defined. To begin with, DQ rules should be specified on a technical level, e.g.: which data field has to fulfil which criteria at what point of the process? Different quality levels can be determined, such as “mandatory” and “optional” data quality. If a data record doesn’t conform to the expected mandatory level, it is withheld in the corresponding process step in order to be revised. Next, KPIs (Key Performance Indicators) on which these quality rules may have a positive impact should be identified. One of the most frequently used key performance indicators to measure data quality is the time-to-market index. It is defined as the average amount of time it takes for a data record to be generated and processed before it is released on a sales system. If this performance indicator is measured at the beginning of a DQ project, and if one of the main goals of the project is an increased efficiency in generating and maintaining product data, it can be used, at a later stage, to assess whether the implemented improvements are facilitating the promised positive impacts.
In the implementation phase the specified rules are gradually rolled out. User trainings will acquaint key users with the new tools and processes. It is worth writing a clear and concise system documentation, in order to have, at a later stage, a reference point for any issue that might arise.
During the implementation phase or at the latest when the new processes are put into practice, data quality improvements can start to be assessed. This is best achieved by the use of dashboards that show results in a clear and intuitive way. With one of the key tools in DQ Management, Informatica Data Quality, users gain full visibility of the evolution of data quality scorecards along different dimensions, including a cost indication.
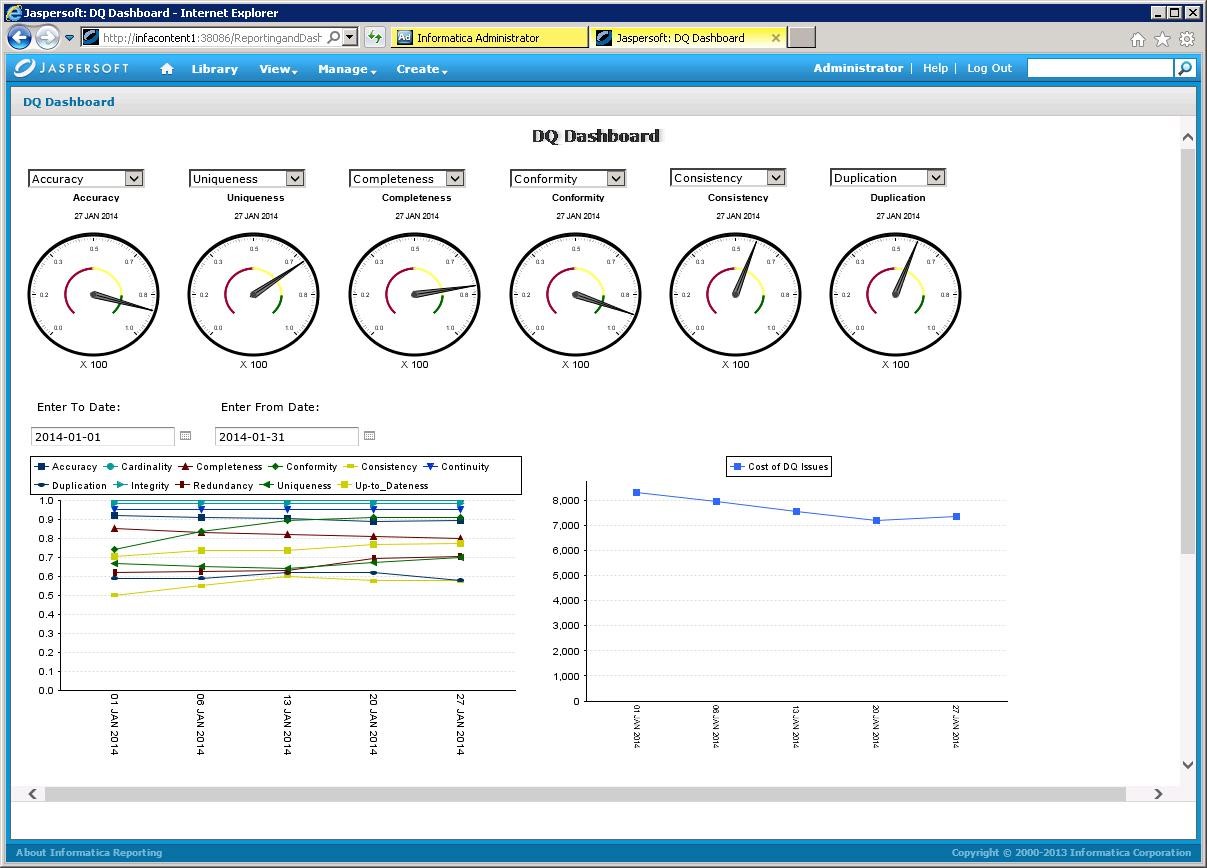
Source: https://marketplace.informatica.com/solutions/data_quality_dashboards_and_reporting_961
This type of dashboard is not only interesting for data controllers; it also allows for the above procedure to be used in an iterative project approach in order to achieve a gradual improvement in data quality. Since phases can vary significantly in length – depending on the context, they may take from a few days to several weeks and months – we can’t make any recommendations.
In the next part of this series, we will focus on metrics used to calculate the Return on Investment of a DQ project and specify methods of dynamic investment calculation to perform a reproducible and reliable cost-benefit analysis.
>> Measuring the ROI of Product Data Quality – Dynamic Investment Appraisal
Read the other parts of this article series as well:
Part 1: Measuring the ROI of Product Data Quality – Basic Principles
Part 3: Measuring the ROI of Product Data Quality – Dynamic Investment Appraisal